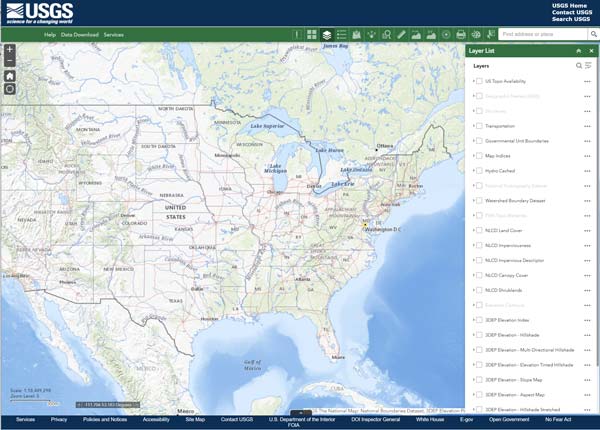
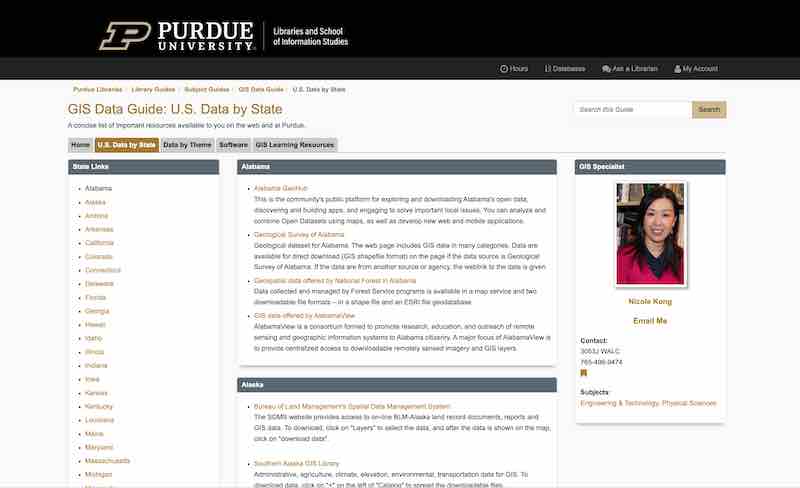
One of the most time-consuming parts of building maps is finding the data sets you want. I’m often forgetting where I found different datasets, and I wanted to share some of the ones I like to go back to.
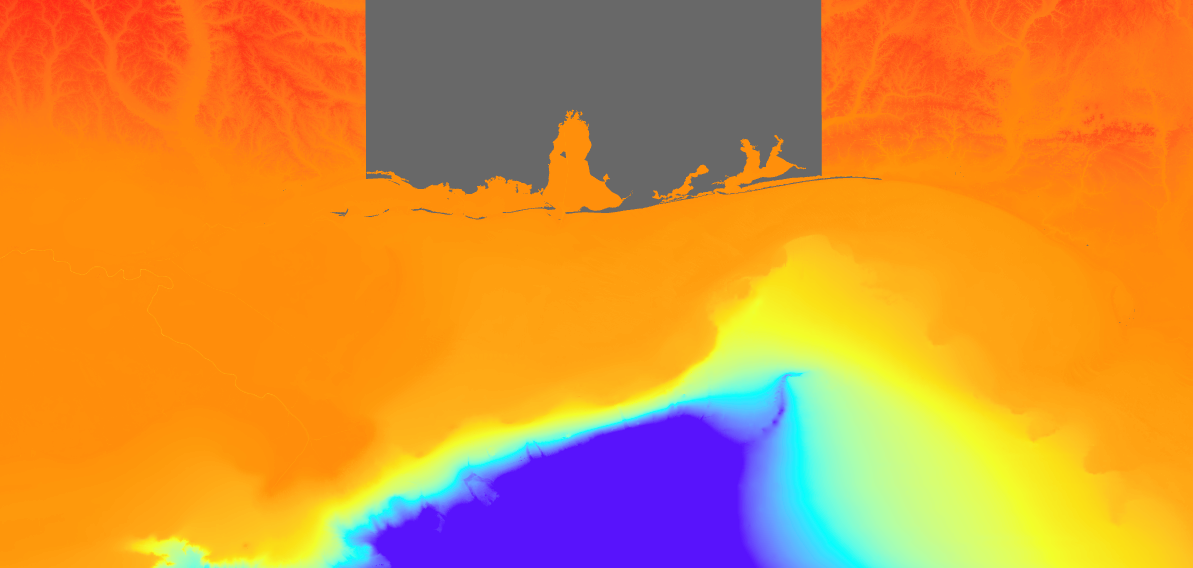
Filter only by DEM Footprints. I’m going to use the Northern Gulf of Mexico 1 arc-second. Click the link for the metadata then download the NetCDF file (750MB).
ArcGIS doesn’t work natively with NC files, so from the View ribbon, click Geoprocessing button to open the Geoprocessing panel, search for Make NetCDF Raster Layer
Input NetCDF File: northern_gulf_1_navd88_.nc
Use the defaults for the next three options Variable: Band 1 X Dimension: lon y Dimension: lat Change the Output Raster Layer something more descriptive: NorthernGulfDEM Leave the other defaults:
This can take a few minutes to process but when it’s done the new raster layer will have the Bathymetry color scheme.
This section covers way more area than I need, so I’m going to crop it using the Intersect tool so future changes won’t require as much processing power.
Create Feature Layer and Cropping Polygon
First create a feature layer.
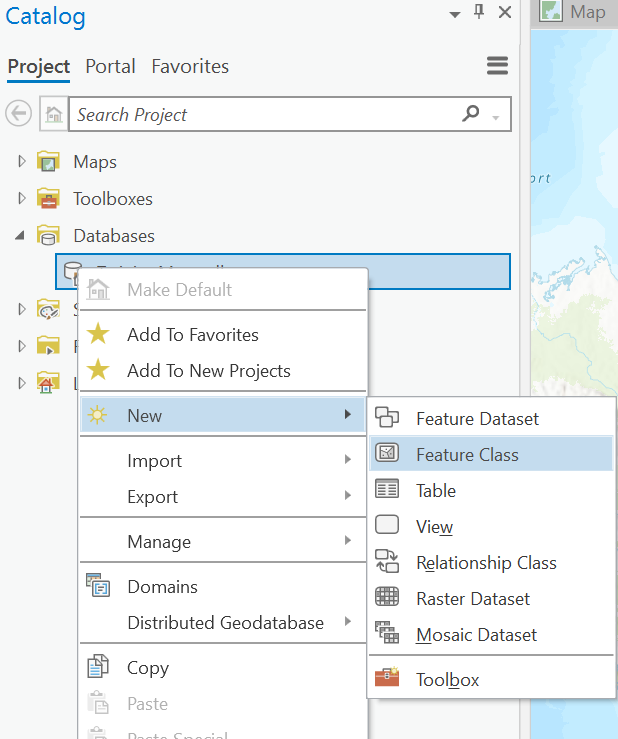
Open Catalogue pane (View ribbon, Windows section) Expand Databases Right-click on the home database (TrainingMap.gdb) go into New, then select Feature Class
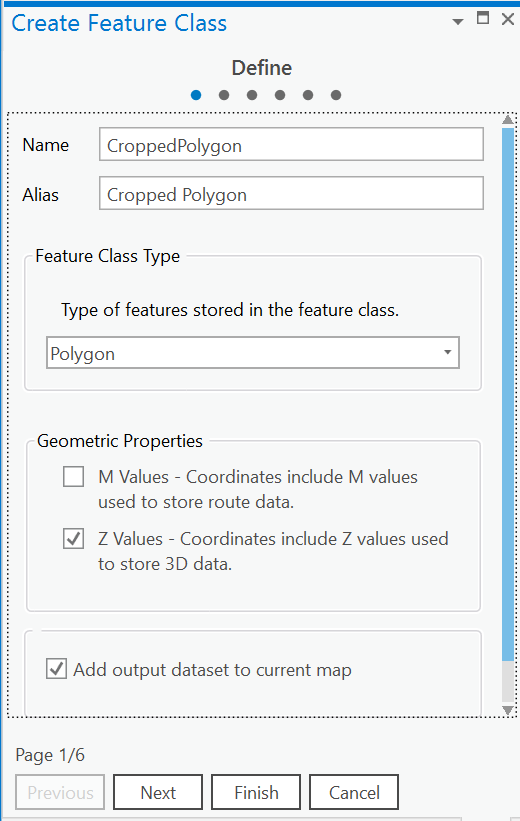
Name the new class Name: CroppingPolygon Alias: Cropping Polygon Type: Polygon M Value: Unchecked Z Value: Checked Add output dataset to current maps: Checked
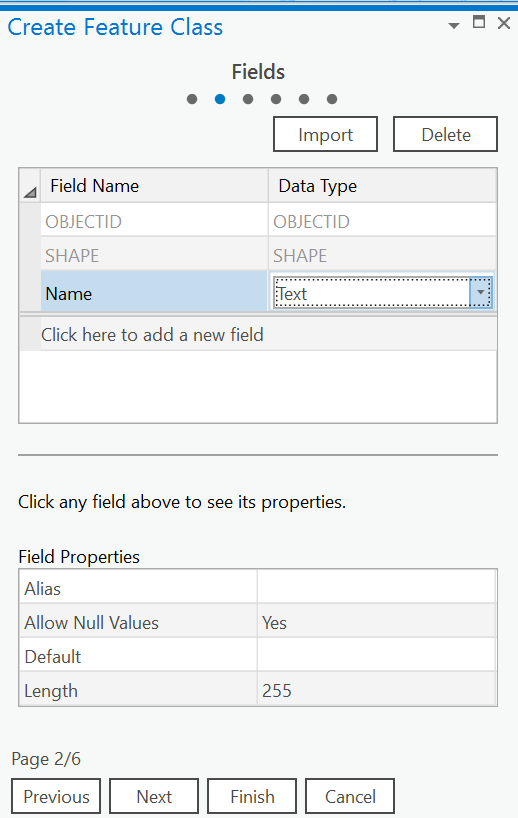
Hit Next, then add a new Field Field Name: Name Data Type: Text
Hit Next On the Spatial Reference page, make sure you are using the coordinate system you are using on the rest of the map.
Hit Next Keep defaults on the Tolerance page XY Tolerance: 0.001 Z Tolerance: 0.001
Hit Next and keep defaults on the Resolution page
Hit Next and keep defaults on Storage Configuration, then hit Finish.
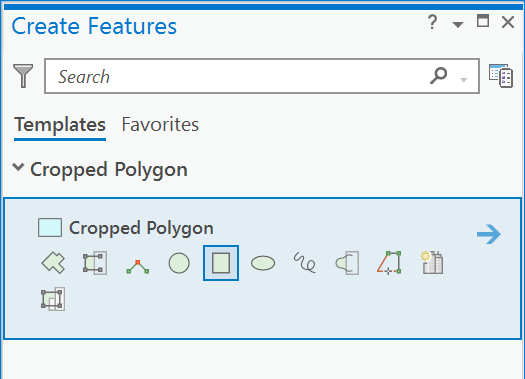
From Edit ribbon, Features section, click the Create button to open the Create Feature panel
Double-click Cropped Polygon, and select the Rectangle tool
The Rectangle Tool works by clicking the top left point of your rectangle, then clicking the top right point of your rectangle, then clicking the bottom right corner of the rectangle.
Hit the green check mark at the bottom of your map, then click the Save button on the Edit ribbon to save this new polygon to the database. ArcGIS then asks, “Save all edits?” Click yes.
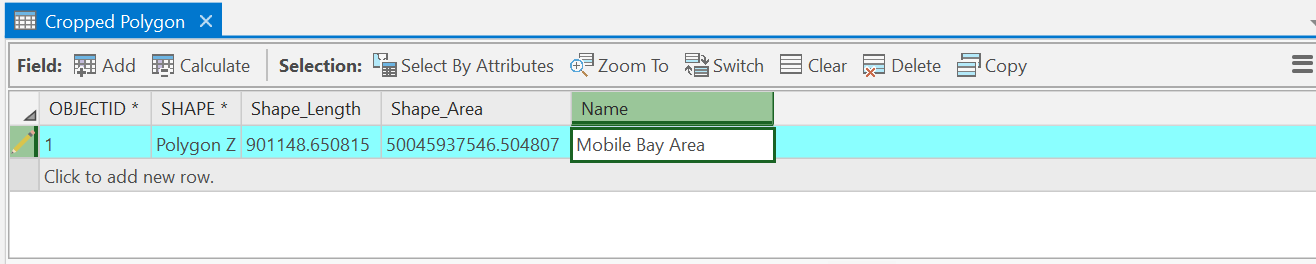
In the Contents panel, right-click on the Cropped Polygon layer and open the Attributes Table. Double click <null> in the name column of the entry for the new polygon and give it a descriptive name: Mobile Bay Area.
Click the Save button again from the Edit ribbon.
Cropping with the Clip Raster tool
From the View ribbon, select Geoprocessing to open the Geoprocessing panel Search for Clip Raster and double-click to open the Clip Raster panel
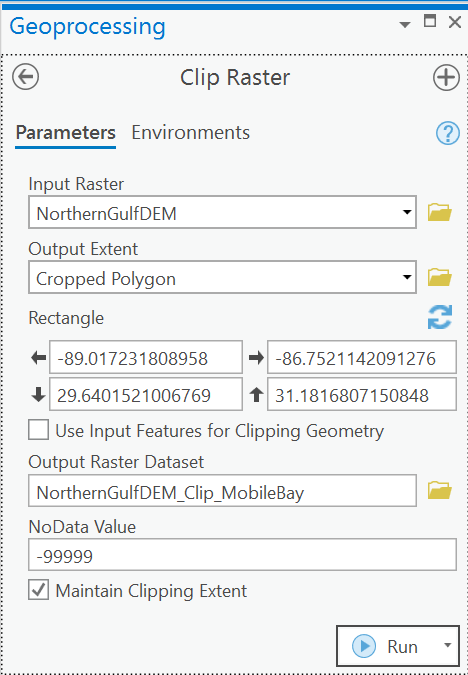
In the parameters page: Input Raster: NorthernGulfDEM Output Extent: Cropped Polygon, Leave the Rectangle options Output Raster Dataset: NorthernGulfDEM_Clip_MobileBay Check Maintain Clipping Extent (otherwise, you’ll end up getting a different section of the image) Click Run
From Contents panel, uncheck both the Cropped Polygon and NorthernGulfDEM layers.
Create Contours from DEM
From the View ribbon, select Geoprocessing to open the Geoprocessing panel Type into the search “Contour” then open the Contour (3d Analyst Tools)
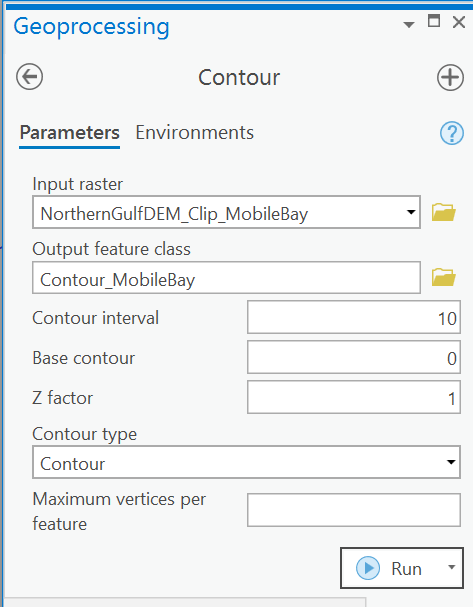
On the Parameters page of the Contour tool, set the following values: Input raster: NorthernGulfDEM_Clip_MobileBay Output: Contour_MobileBay Contour Interval: 10 (assumed Meters because in Map properties, on the general tab, the Map Units are set to Meters) Base contour: 0 Z factor: 1 (change this if converting meters to feet, etc) Contour Type: Contour
Simplify Contour
NOTE: you may need to run DEFINE PROJECTION geoprocessing tool on the contours before simplifying.
Open the Geoprocessing Panel (from View ribbon) Search for Simplify Line, and open it.
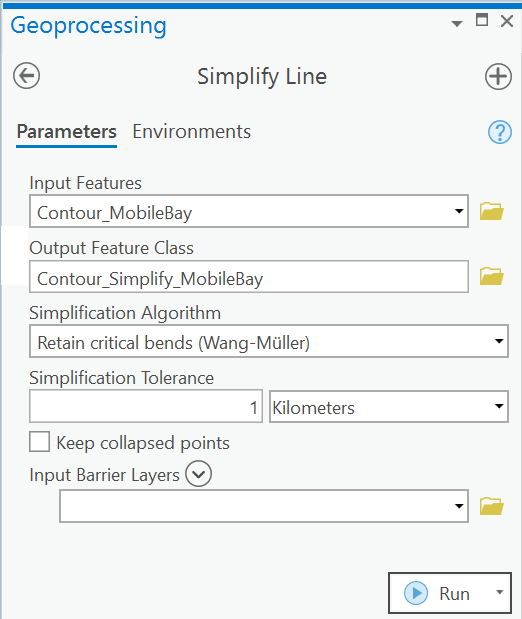
From the Parameters page set the following values: Input Feature: Contour_MobileBay Output Feature Class: Contour_Simplify_MobileBay Simplification Algorithm: Retain critical bends (Wang-Müller) Simplification Tolerance: 1 Kilometers Uncheck “Keep collapsed points” Input Barrier Layers: <blank> Click Run (this may take a while, be glad the original DEM is clipped!)
If you get an error: The cartographic spatial reference does not have a projected coordinate system, Use the Define Projection tool to set a projection for your input contour feature.
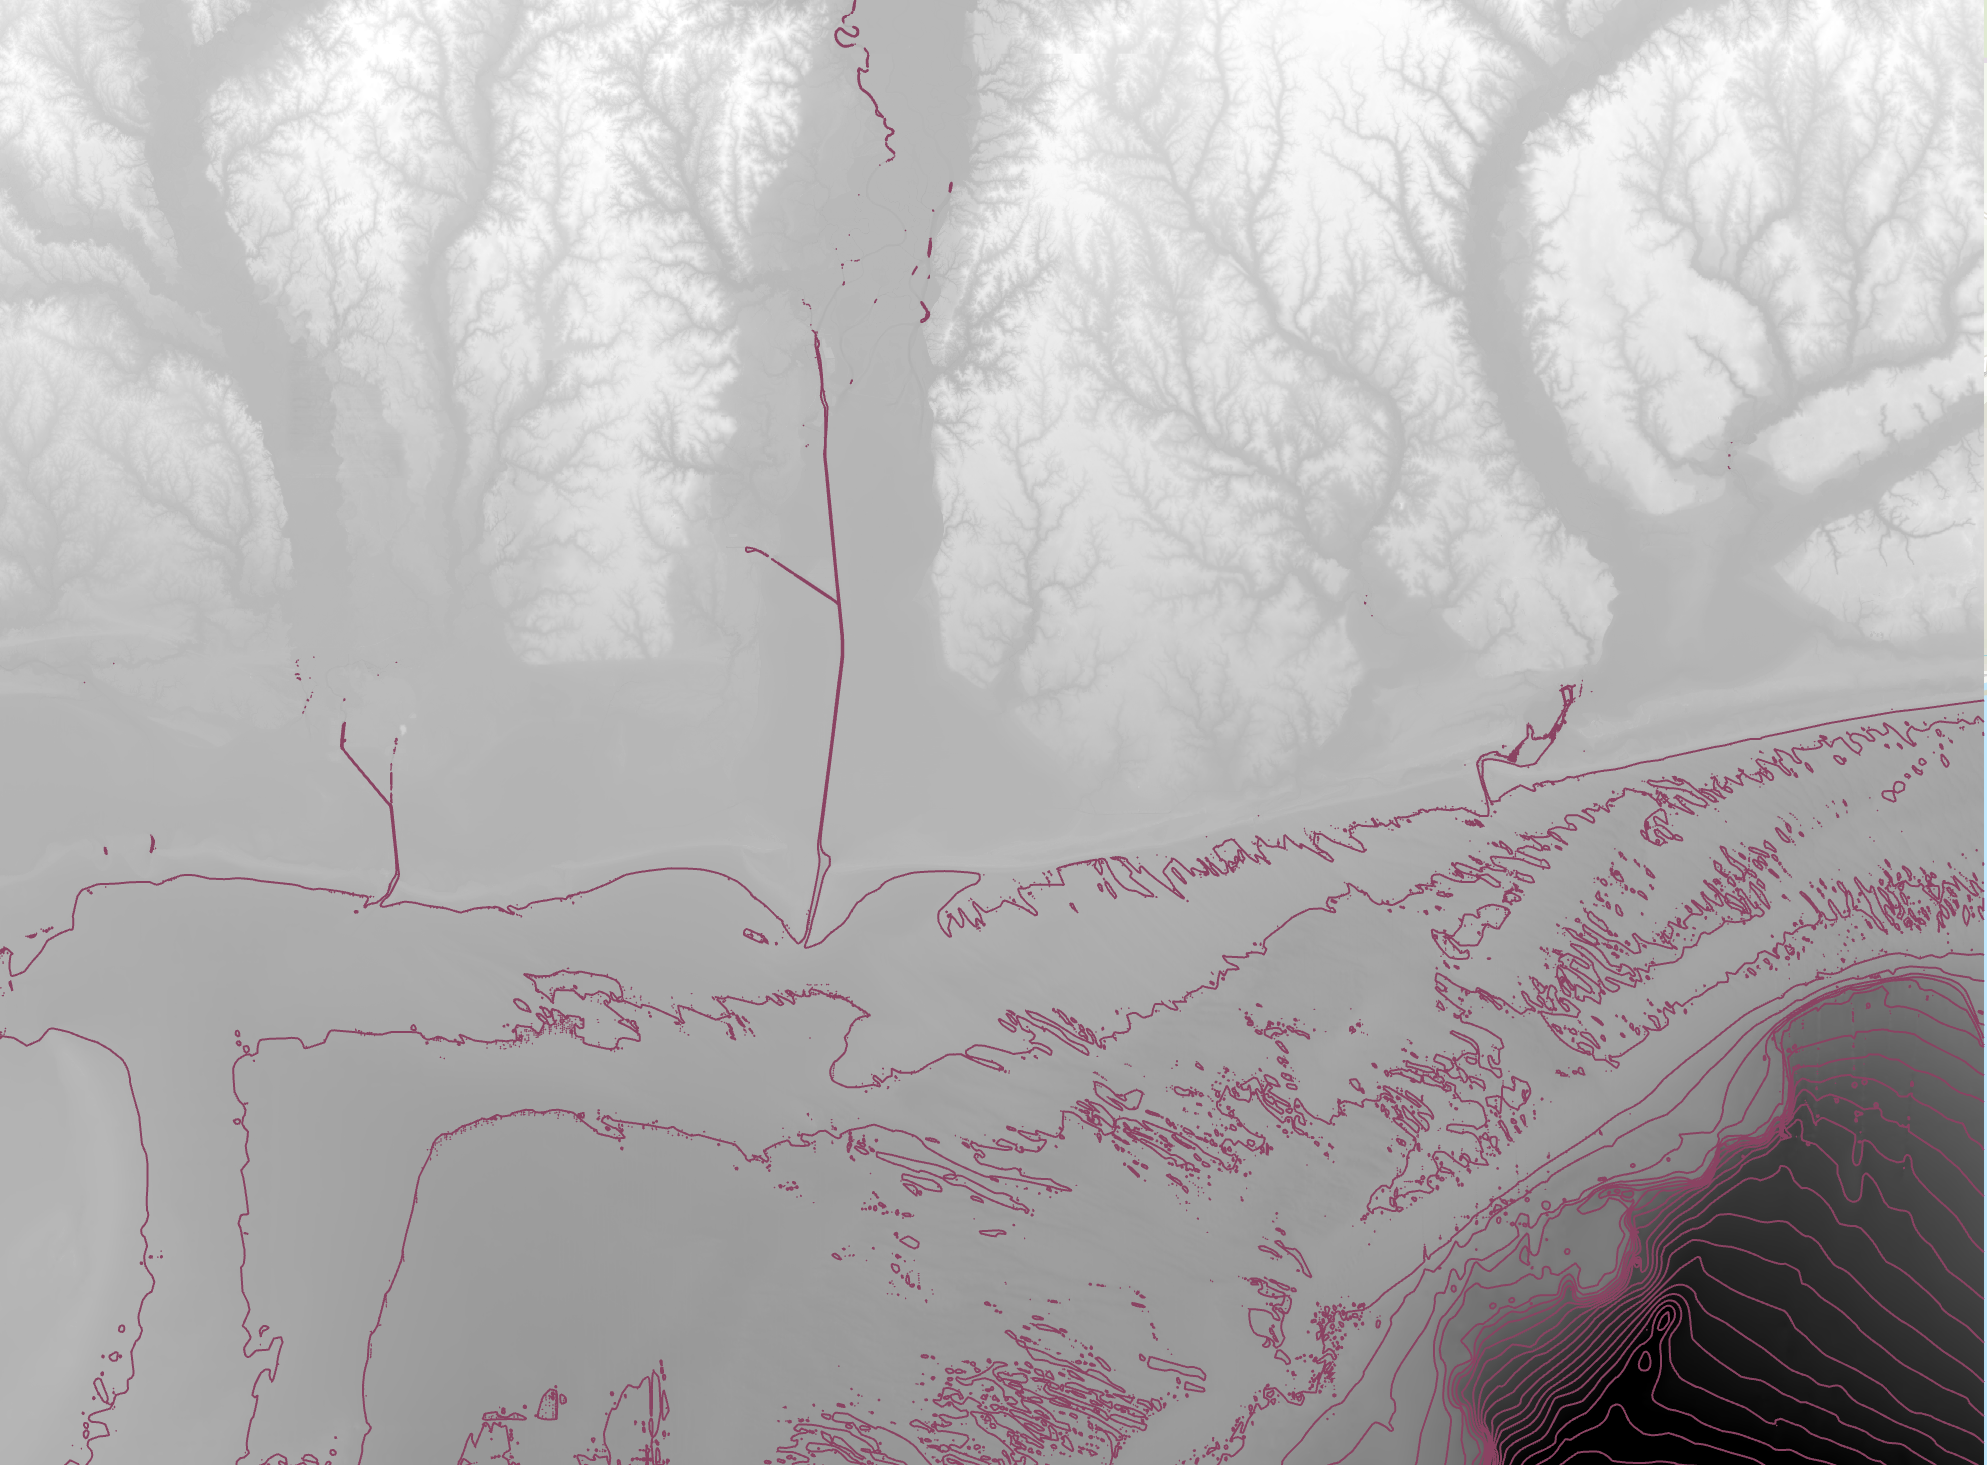
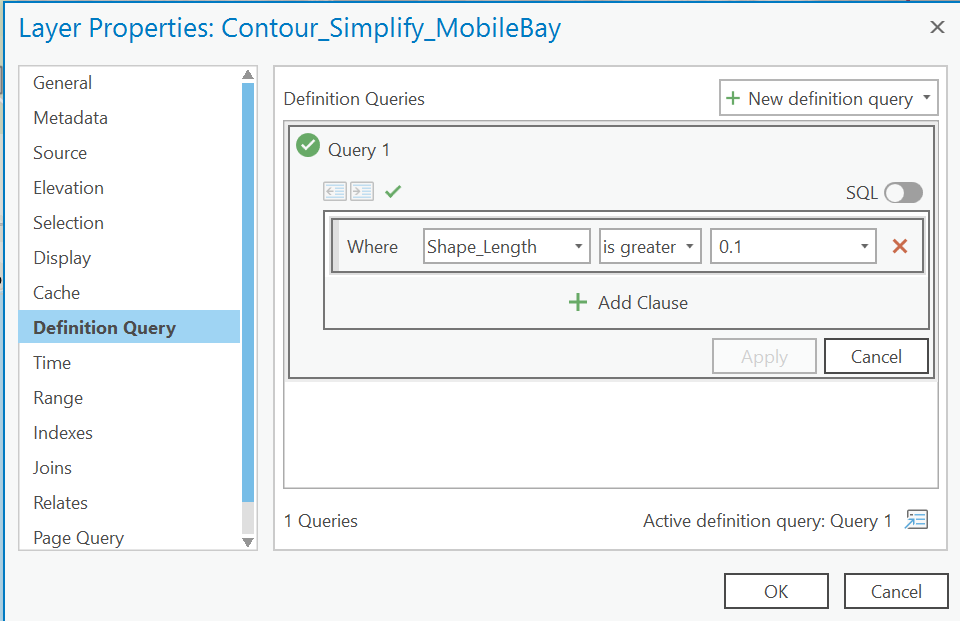
The results look better, but there’s still too many artifacts. Use the Definition Query to clean this up.
In Contents panel Double-click on Contour_Simplify_MobileBay to open its Property panel then navigate to the Definition Query page Hit + New Definition Query Set Query 1 to Where Shape_Length is greater than 0.1
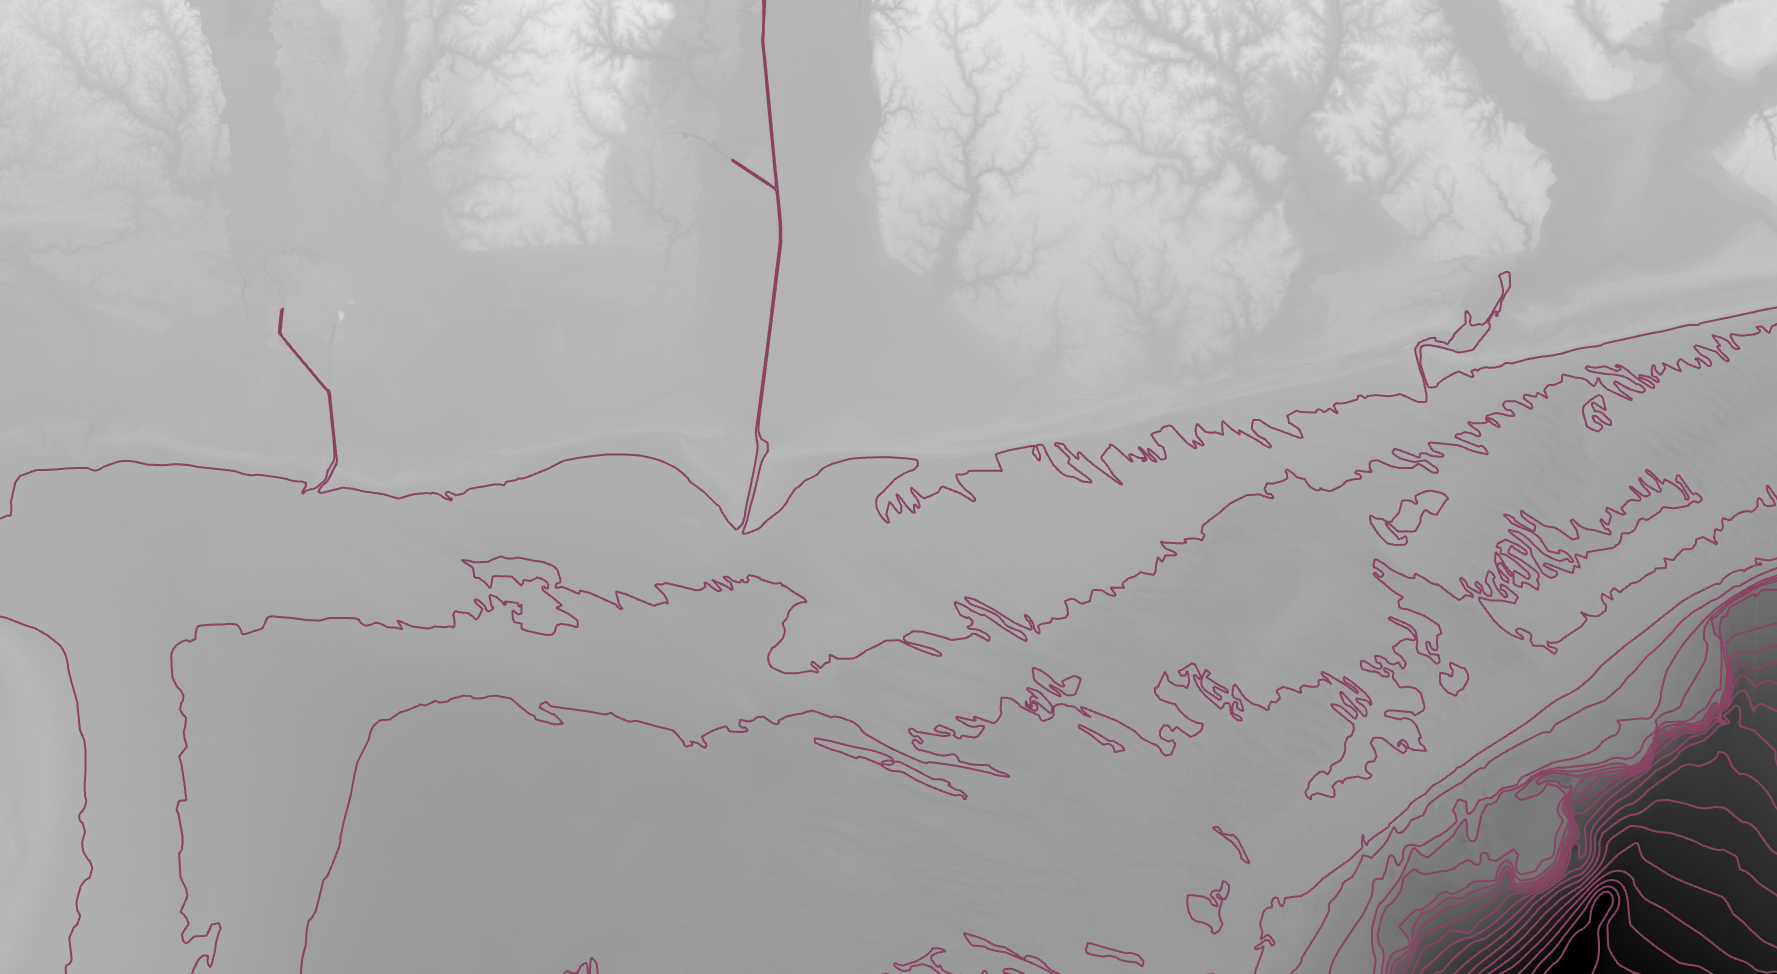
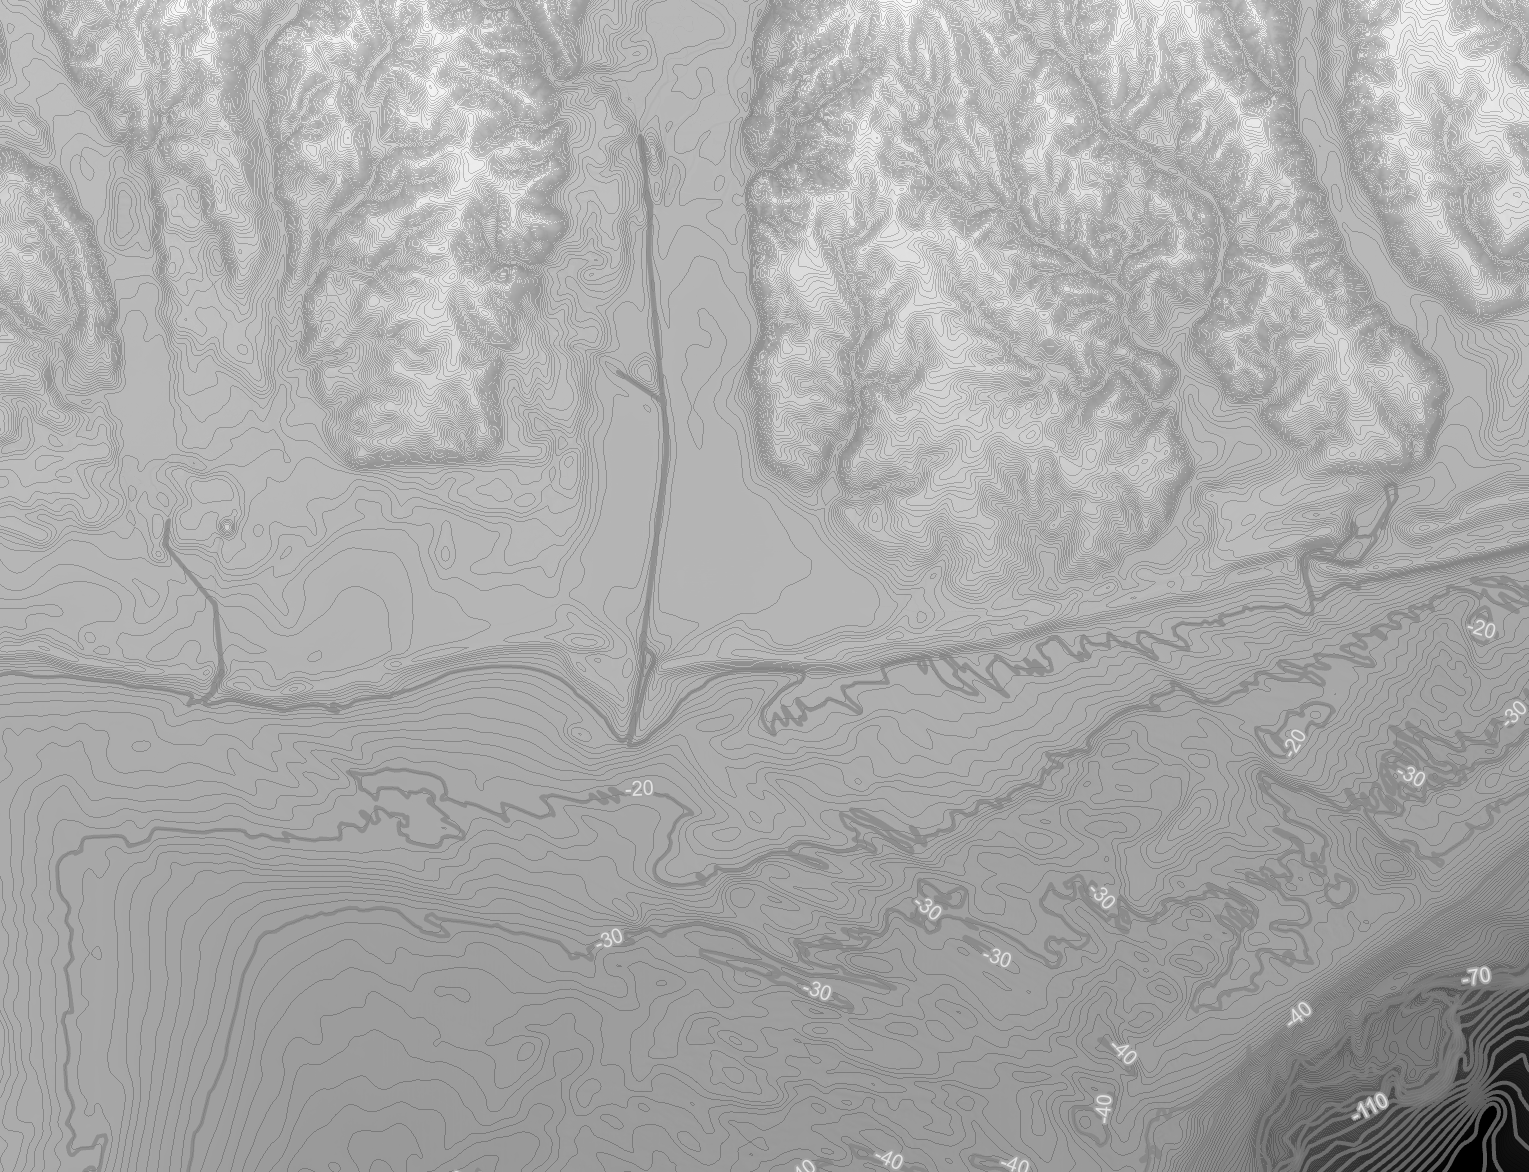
That’s much better!
Create Labels for Contours
The new contours still need labels.
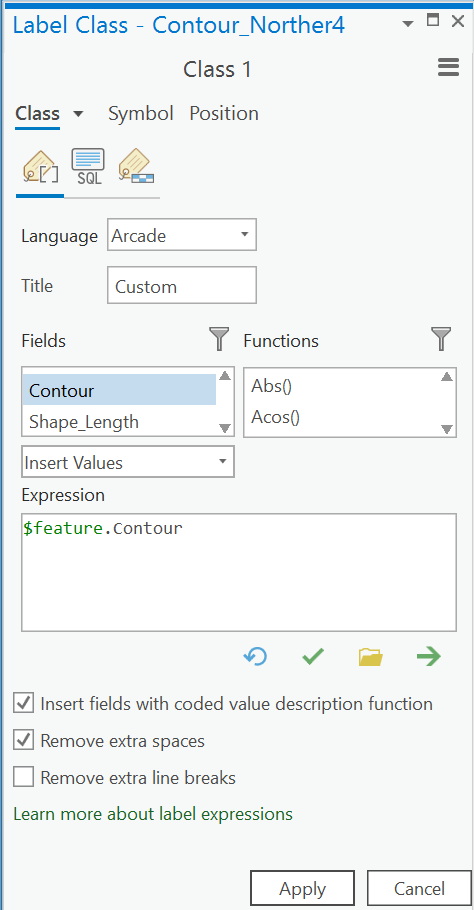
In the Contents panel, right-click on the new Contour_Simplify_MobileBay and select Label to turn on labels Right-click on the feature again and select Label Properties to open the Label Class Properties panel Delete contents of Expression box, then double-click on Contour in Fields to add it to the expression. Click Apply.
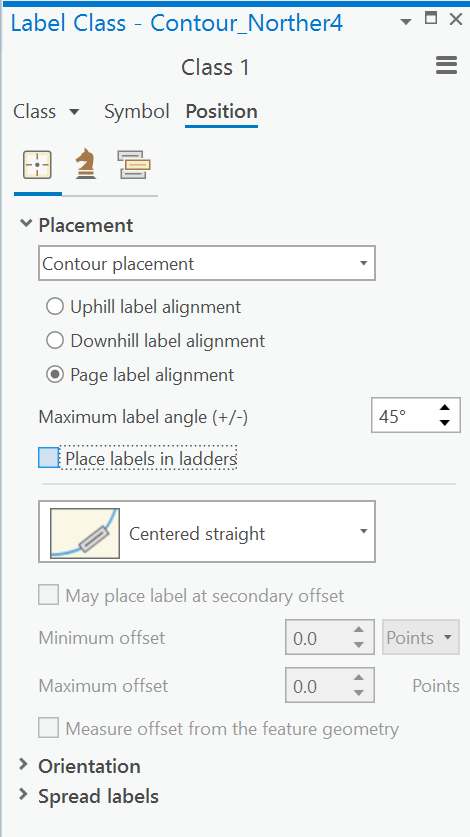
Click on the Position tab Open up Placement, and change Regular placement to Contour placement Chose Page label alignment Adjust “Maximum label angle” to something above 30° Uncheck “Place labels in ladders” (unless you prefer all the labels to line up) Click Apply
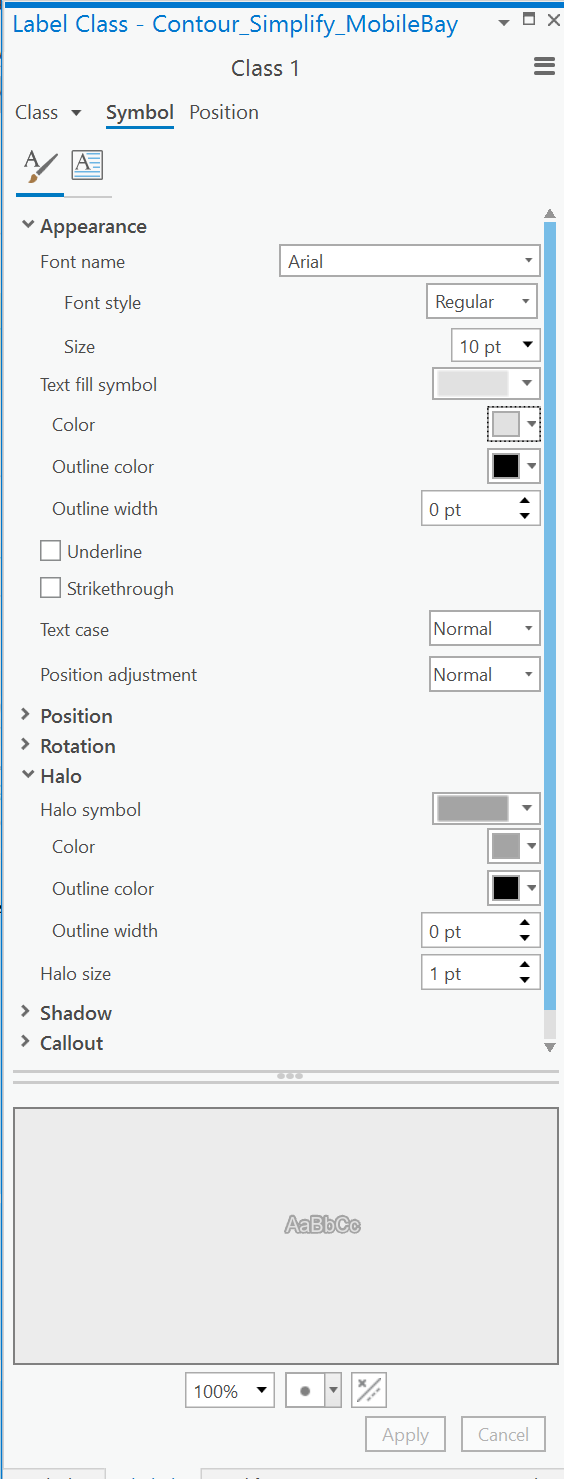
On the Symbols tab of the panel, open Appearance Font name: Arial Font style: Regular size: 10pt Text fill symbol: leave default Color: Gray 10% Open up Halo Halo Symbol: White Fill Color: Use the eyedropper to click anywhere in the water to select the color of the background. Halo size: 2pts Click Apply
We’ll revisit these settings after we decide what our water will look like.
Create Contours with Contour Raster Function
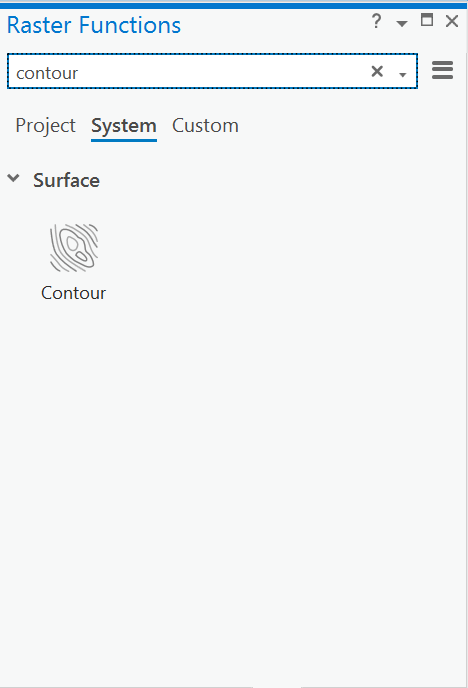
To get intermediate unlabeled contours, select Raster Functions panel (Analysis ribbon, Raster section)
Type in Contour and select the Contour tool
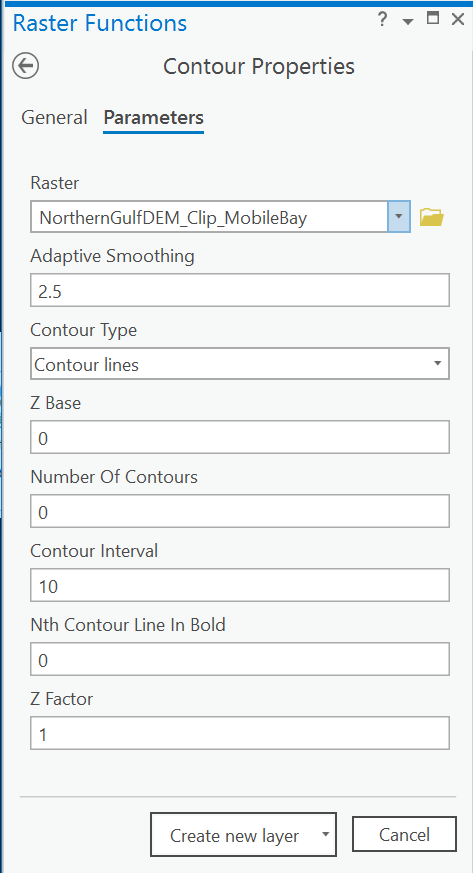
Raster: NorthernGulfDEM_Clip_MobileBay Adaptive Smoothing : 2.5 (default) Contour Type: Contour lines Z Base: 0 Number of Contours: 0 Contour Interval: 1 Z Factor: 1 Click Create new layer
In the contents panel, drag this layer below Contour_MobileBay_Simplify
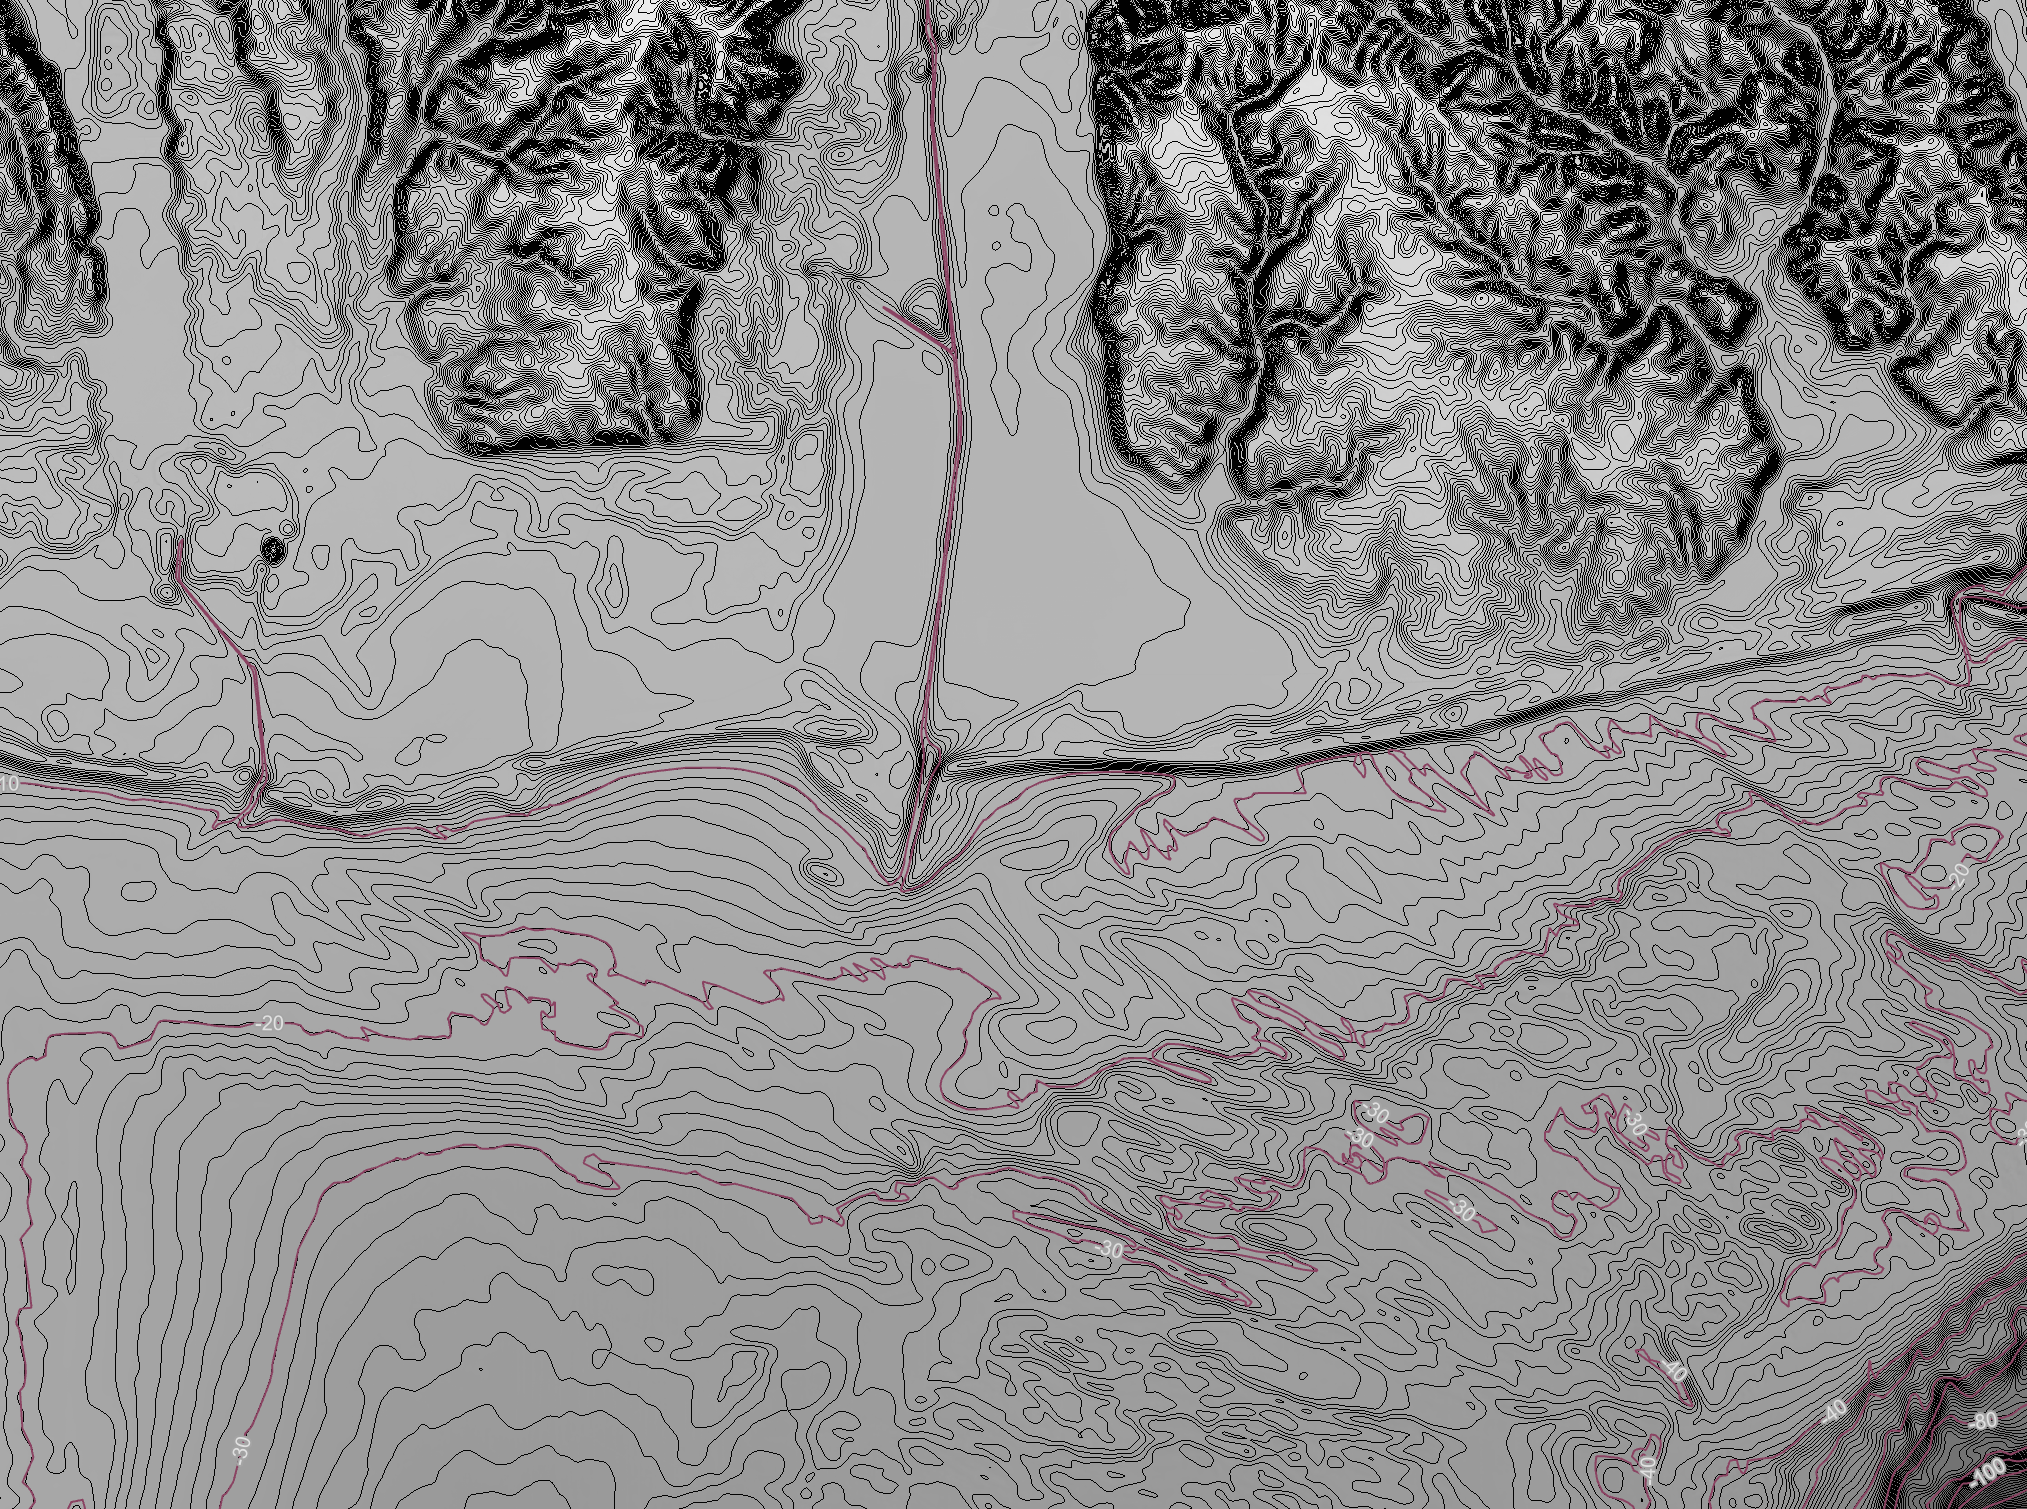
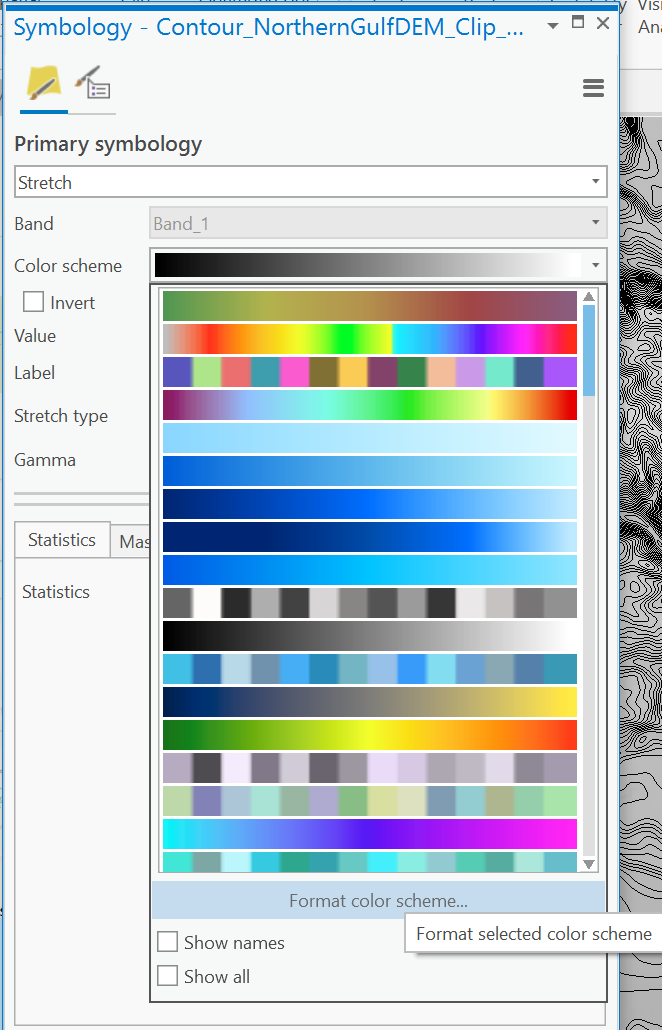
This is way to busy, to change the color of the intermediate contour lines, right-click on Contour_NortherGulfDEM_Clip select Symbology to open the Symbology panel From Color Scheme select Format Color Scheme shown below the list of gradients
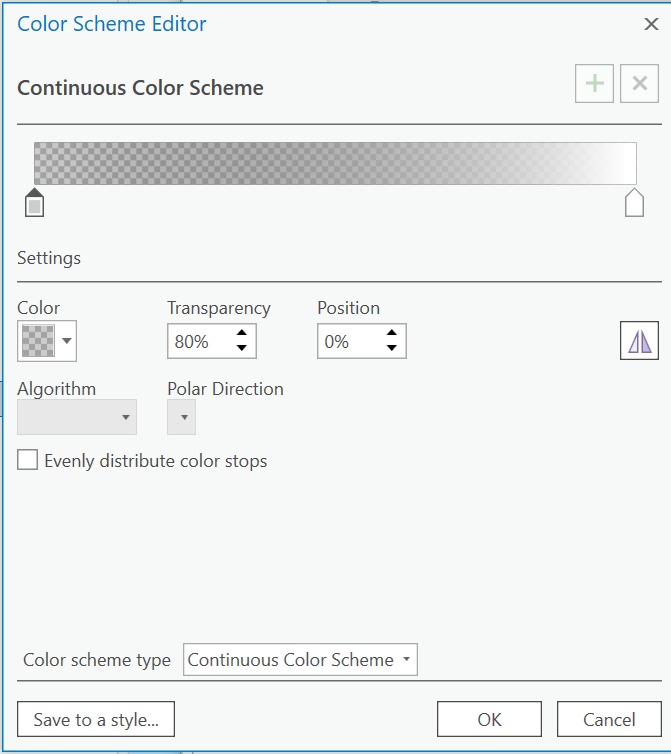
In the Color Scheme Editor, click on the l black box on the left side of the gradient to make it active Either change the color to something with less contrast or set the transparency to 80% Click OK to apply the new color.
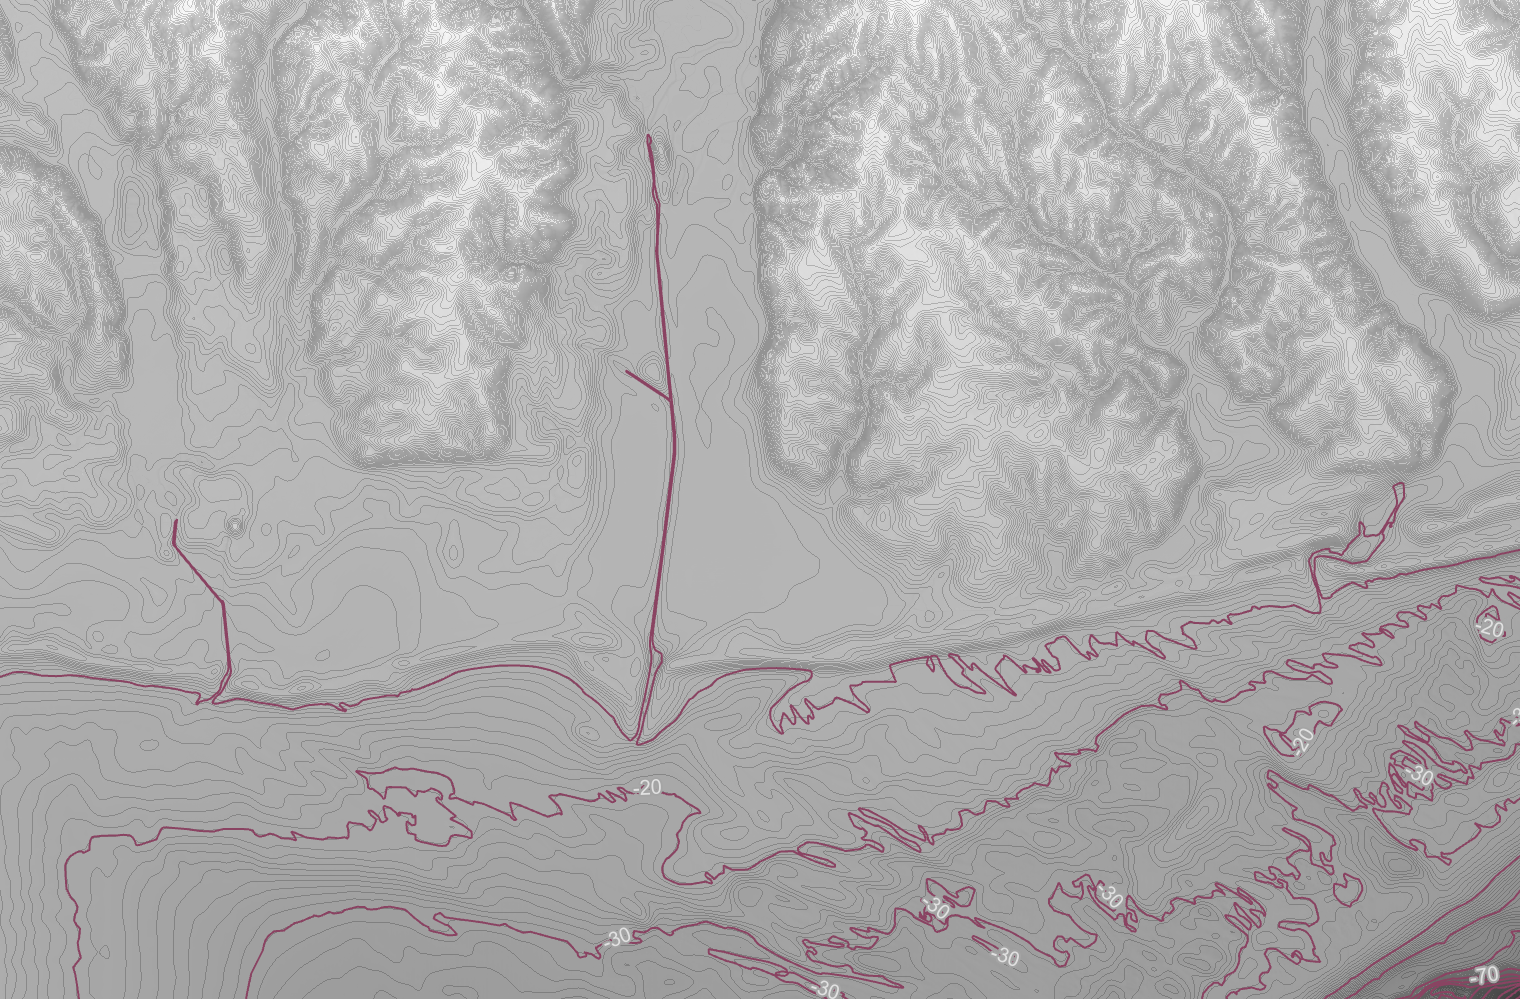
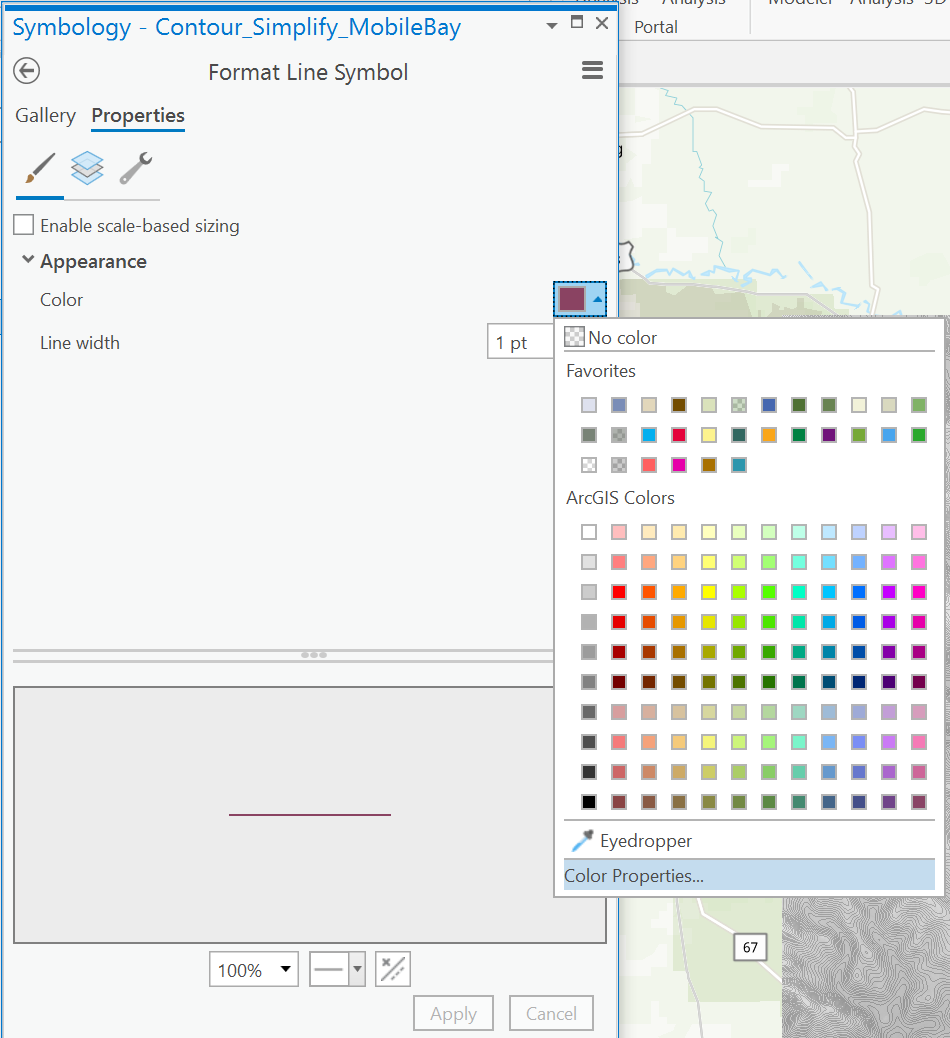
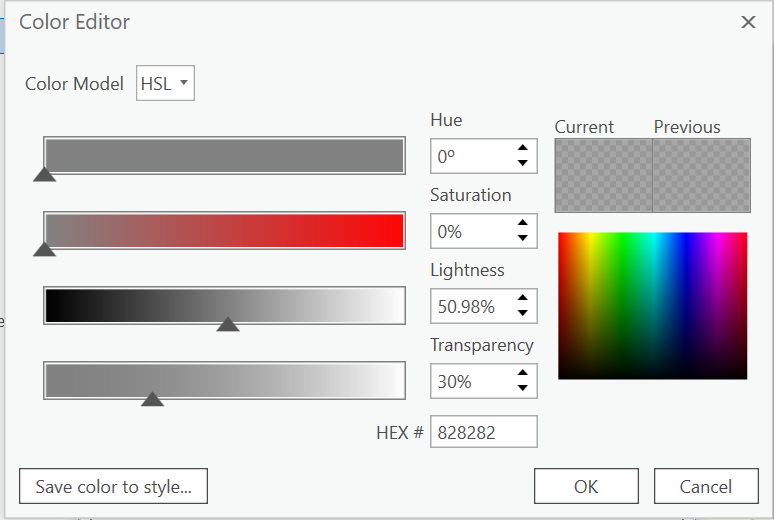
That’s looking better. Change the color of the labeled contour by double-clicking on the line icon under Contour_Simplify_MobileBay in the Contents panel, then switch to the Properties tab Open the color picker and chose Color Properties below the Eyedropper.
Color Model: HSL (This turns the sliders into Hue, Saturation, Lightness, and Transparency) Drag the saturation slider left to 0% Drag darkness left to around 50% Finally, drag transparency right to around 30% Click OK, then click Apply in the Symbology panel
Create Buffer Mask for Contour Labels
Once size and location of labels looks correct, in Contents panel, right-click on your contour layer, and select Convert Labels -> Covert Labels to Annotations
Double-check your Conversion Scale, select your geodatabase, click run.
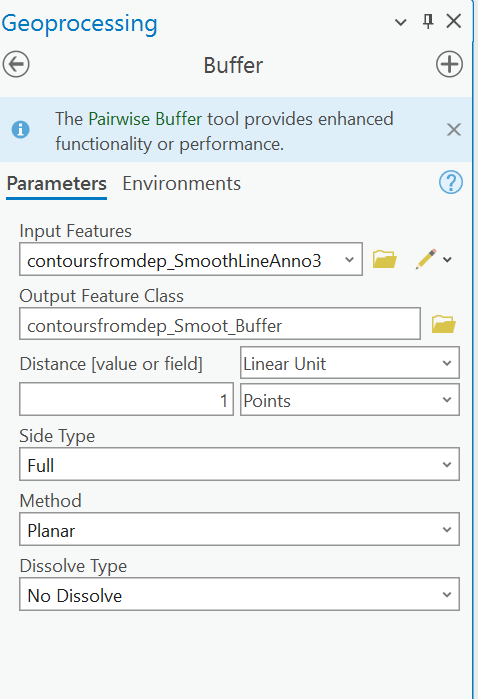
Open Buffer from Geoprocessing Tools -> Spatial Analyst Tools
Input Feature: your annotation layer
Distance: 1 Point
Hide layer.
From Contents panel select your contour label.
From Feature Layer Ribbon, select your buffer label.
If you have a table with values of text that you want to change into numeric values to manipulate symbology, you can use the Python Code Block in the Calculate Field tool.
I want to add a column of numbers to correspond to these text descriptions
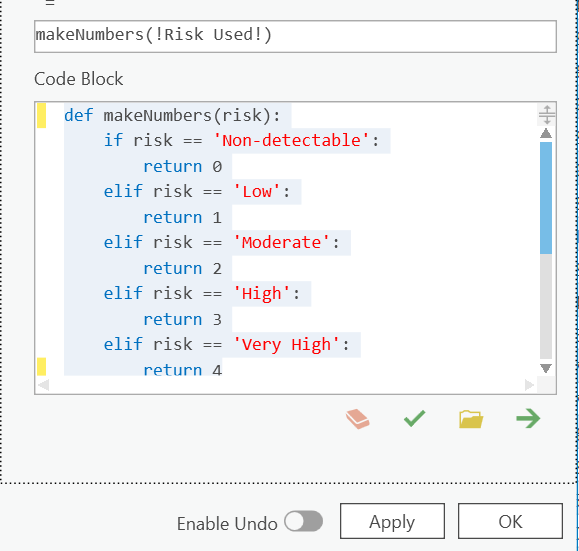
Non-detect -> 1 Low -> 1 Moderate -> 2 High -> 3 Very High -> 4
To do this, I’ll open the table in ArcGIS Pro, then click the Calculate button to open the Calculate Field Panel
In Calculate Field, chose the the table you want to edit, add a new field for your numbers “riskNumbers,” then make that a Long Integer field.
After the “=” add the code:
makeNumbers(!riskName!)
Then in the Code Block Section we’ll define our makeNumbers function:
Turns out you can use RemoteApp Tool to open a remote app on a windows machine on a mac. Here’s how I used it to run ArcGIS Pro to appear like it’s running on my mac.